
NY Gov Tech Awards
Released
A public dashboard of more than 3,000 software, data, and IT service awards from New York City, New York State public authorities, and federal agencies in New York, built from open procurement records with every award linked to its source.
Open the live dashboard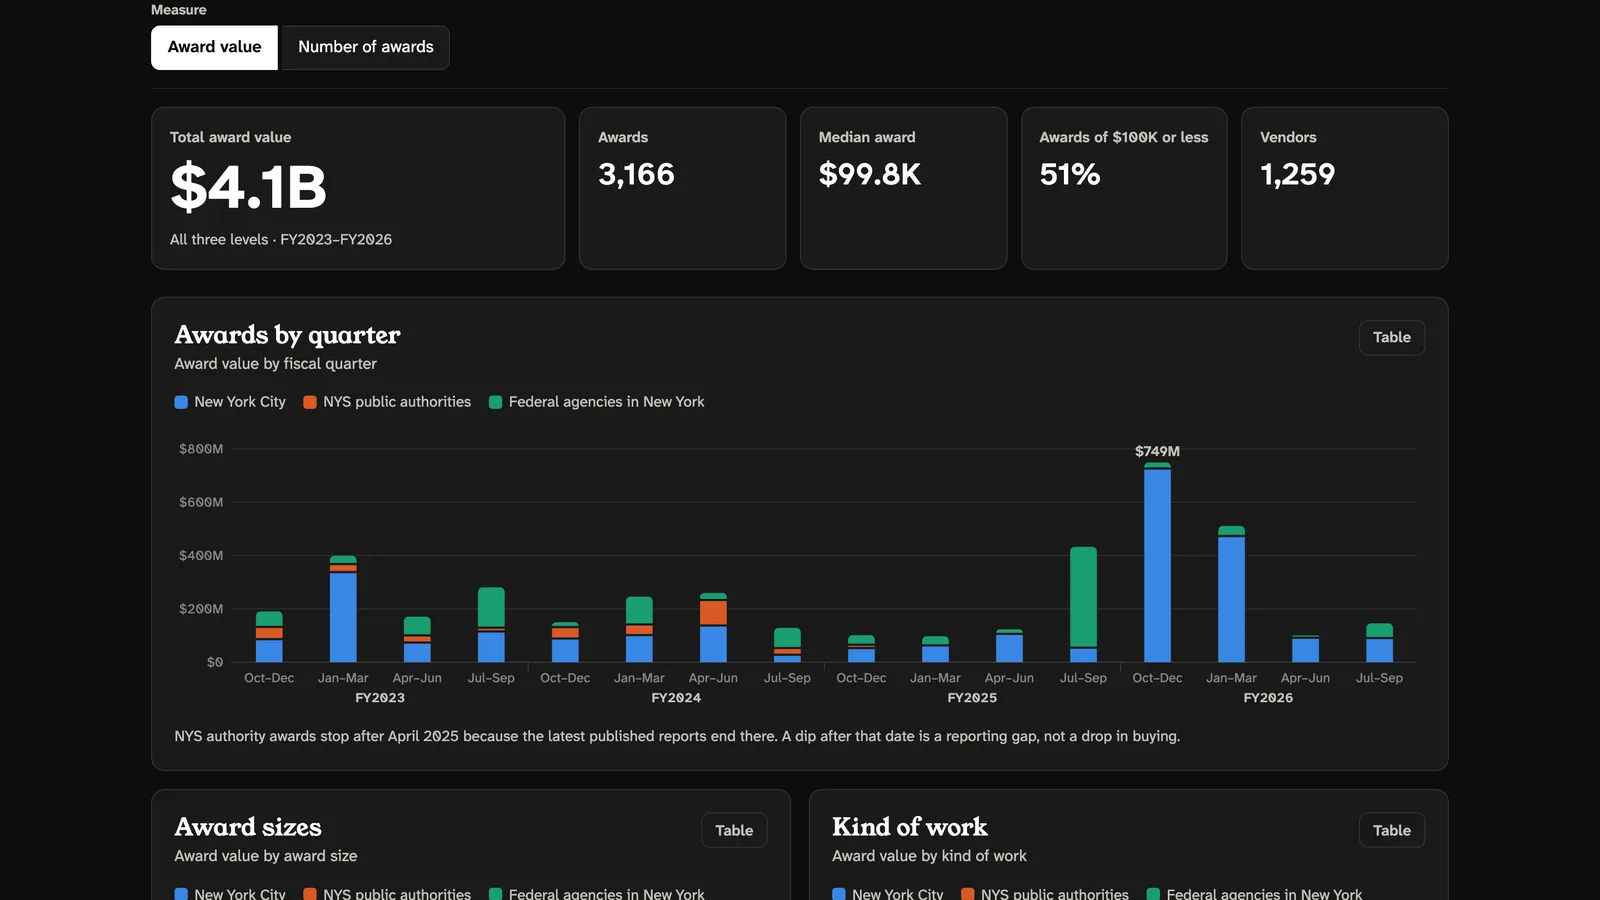 Current build
Development details
- Source code
- Public
Built with
Screenshots
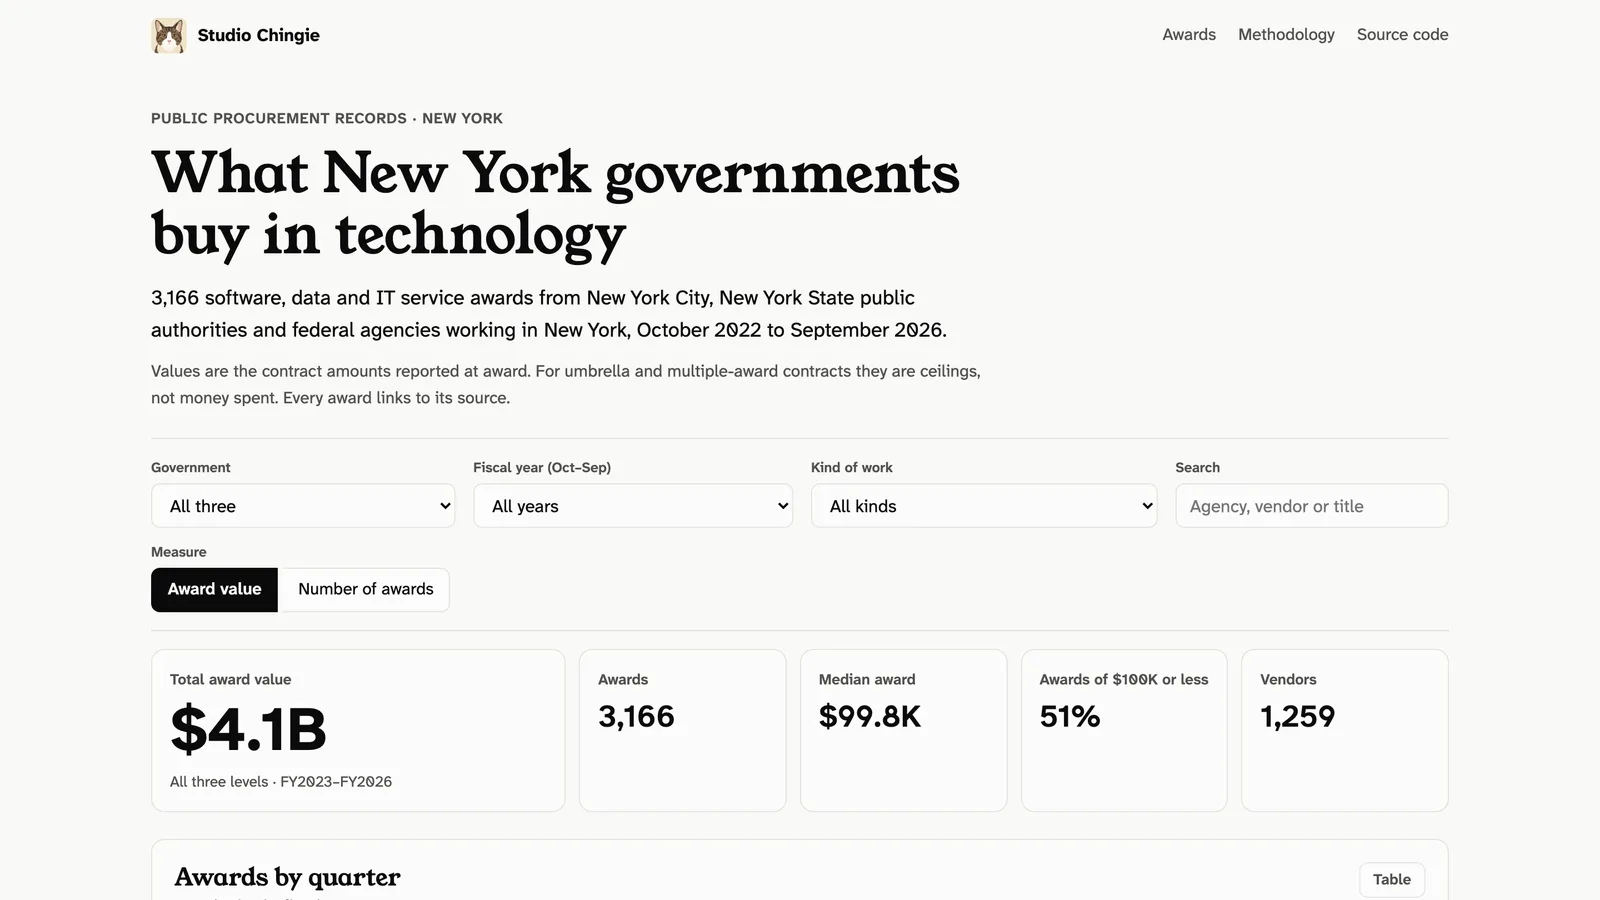
One row of filters scopes every figure, chart, and table on the page, and the view is kept in the URL so it can be shared.
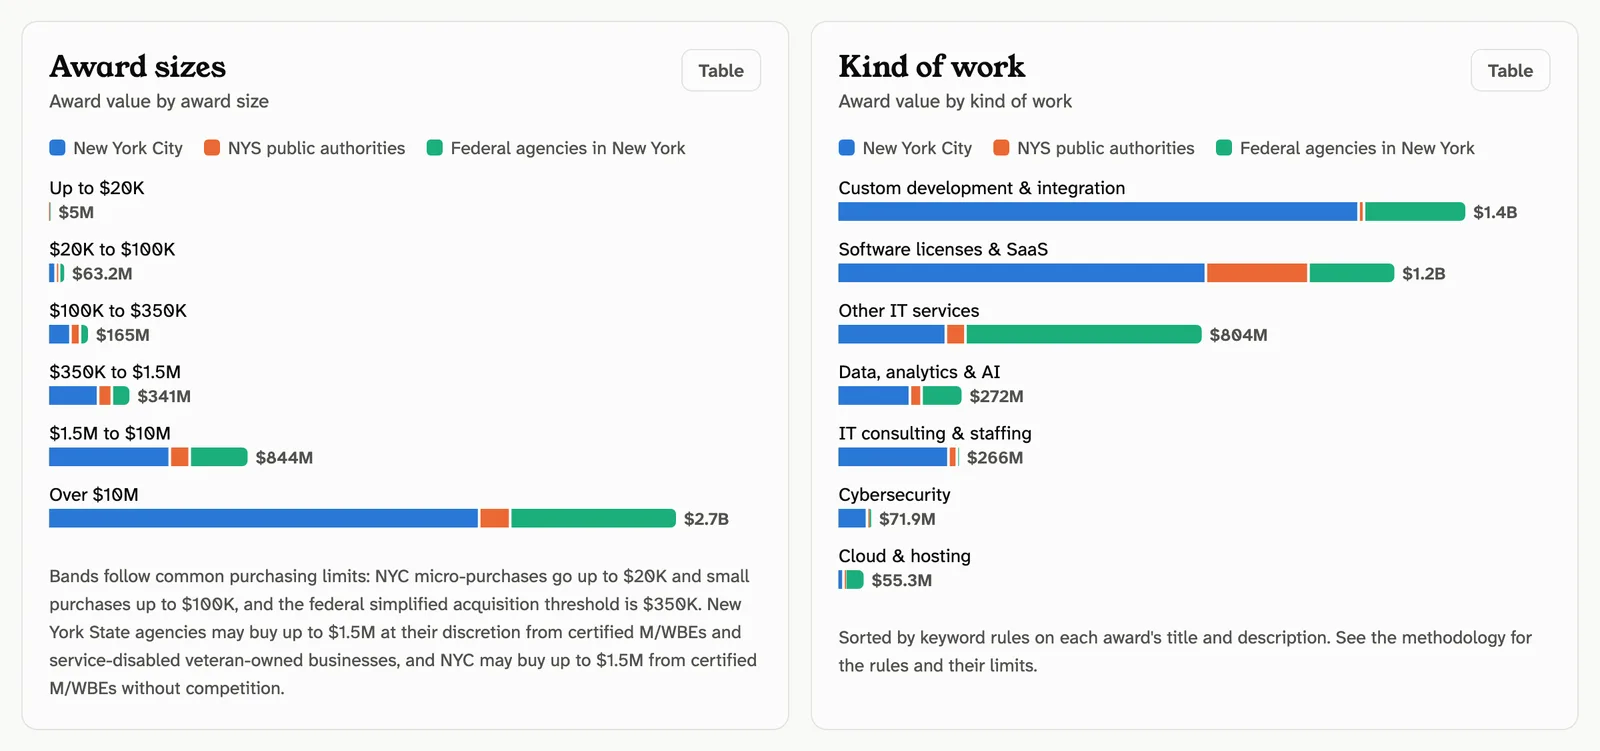
Award sizes are banded at the purchasing limits vendors plan around, from NYC micro-purchases to the $1.5M M/WBE and SDVOB limit.
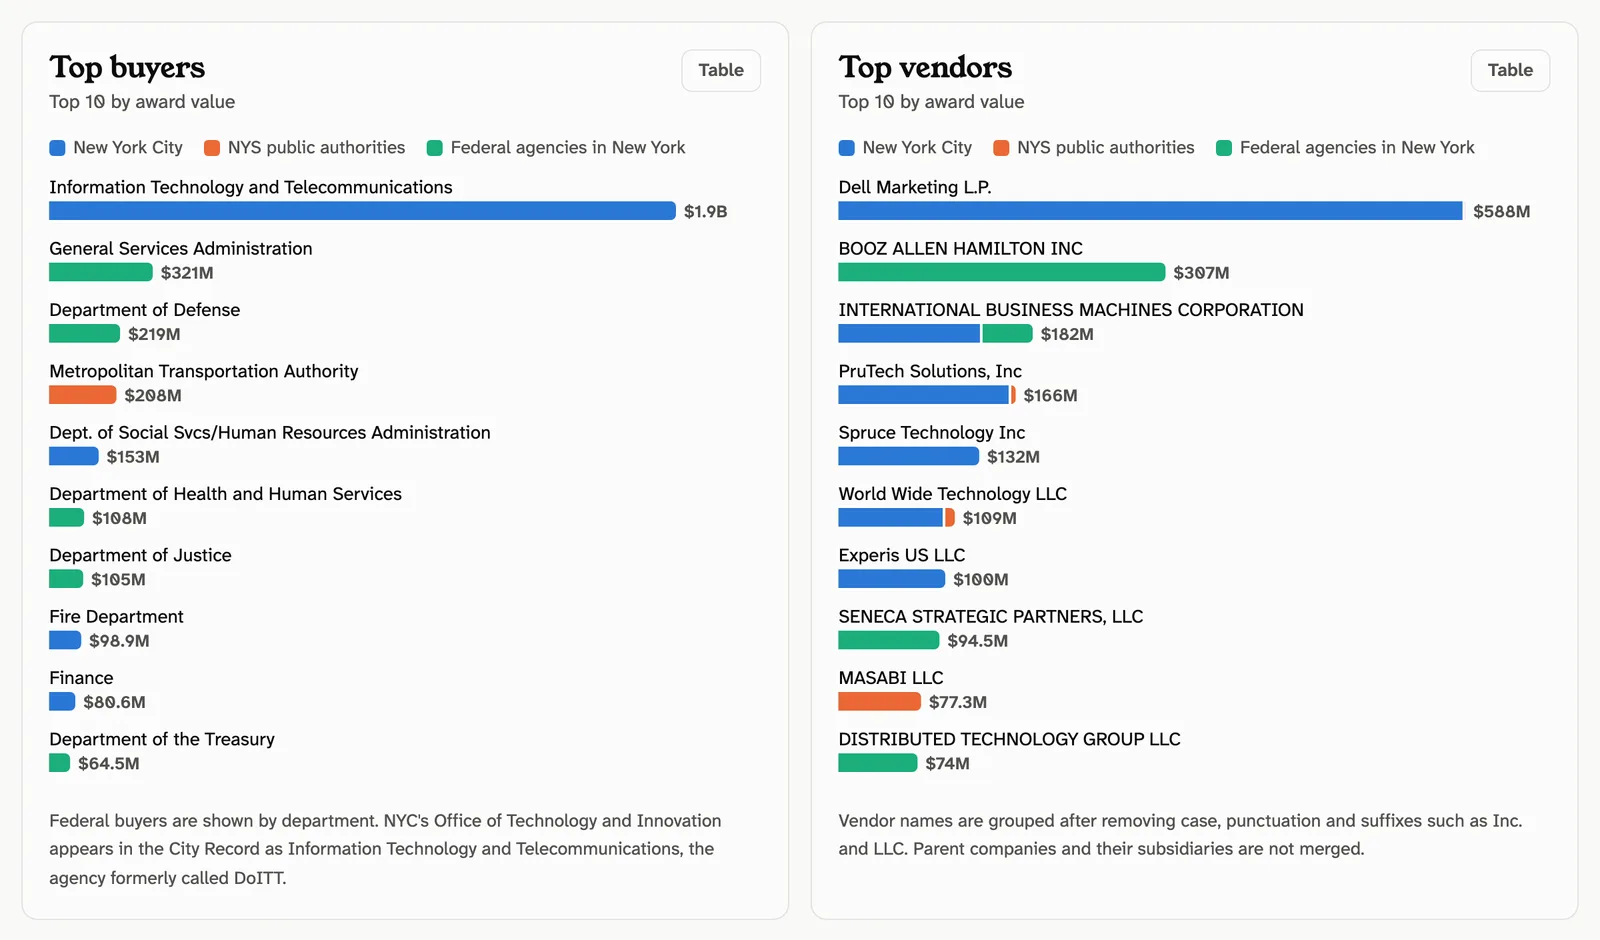
Top buyers and vendors, split by level of government. Vendor names are grouped after removing case, punctuation, and legal suffixes.
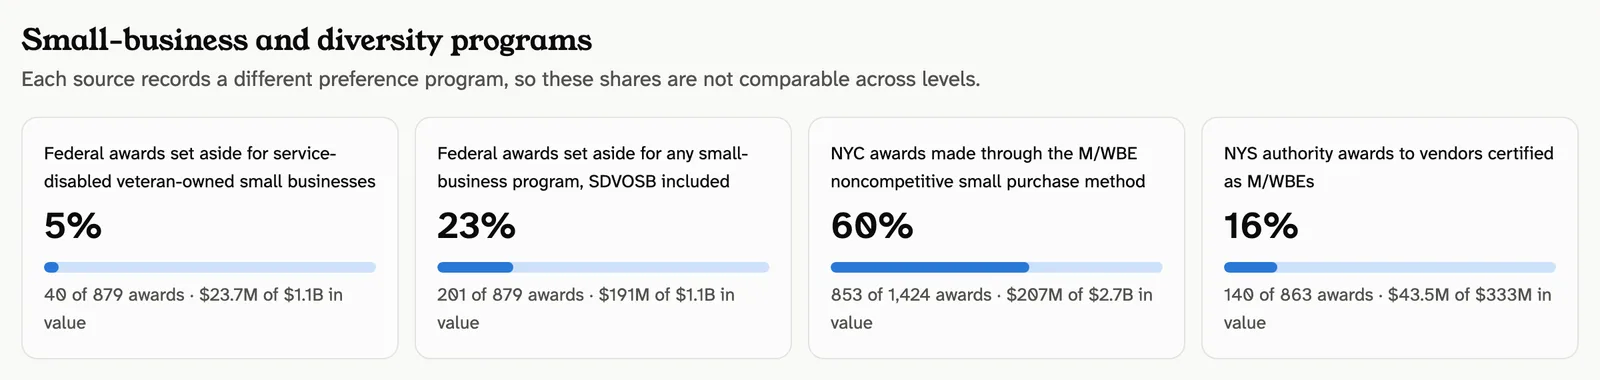
Each source records a different preference program: federal set-asides, NYC's M/WBE small purchase method, and certified M/WBE vendors at state authorities.
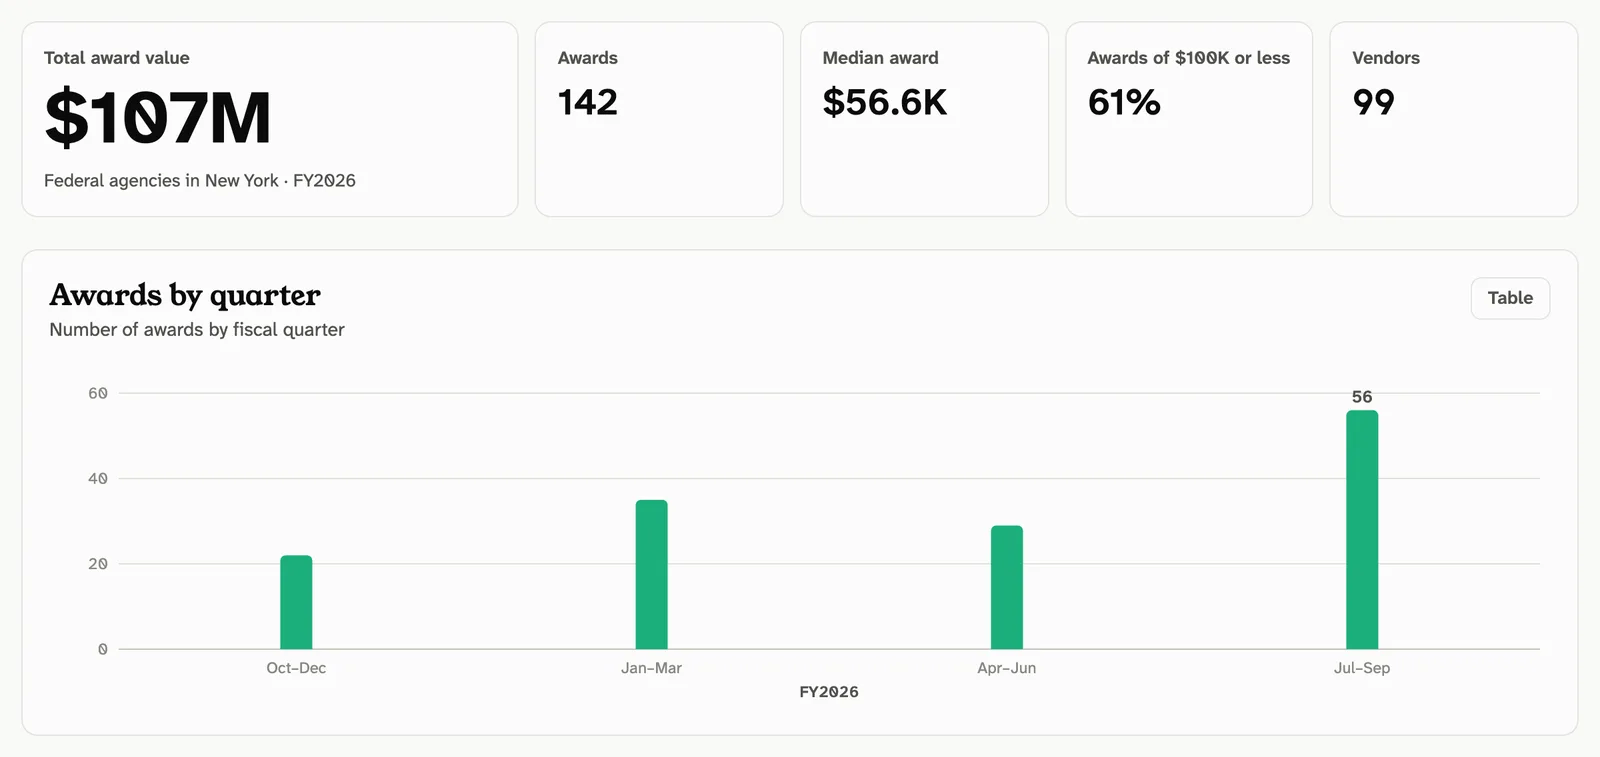
Filtered to federal awards in FY2026 and counted rather than summed: the last quarter of the fiscal year carries the most awards.
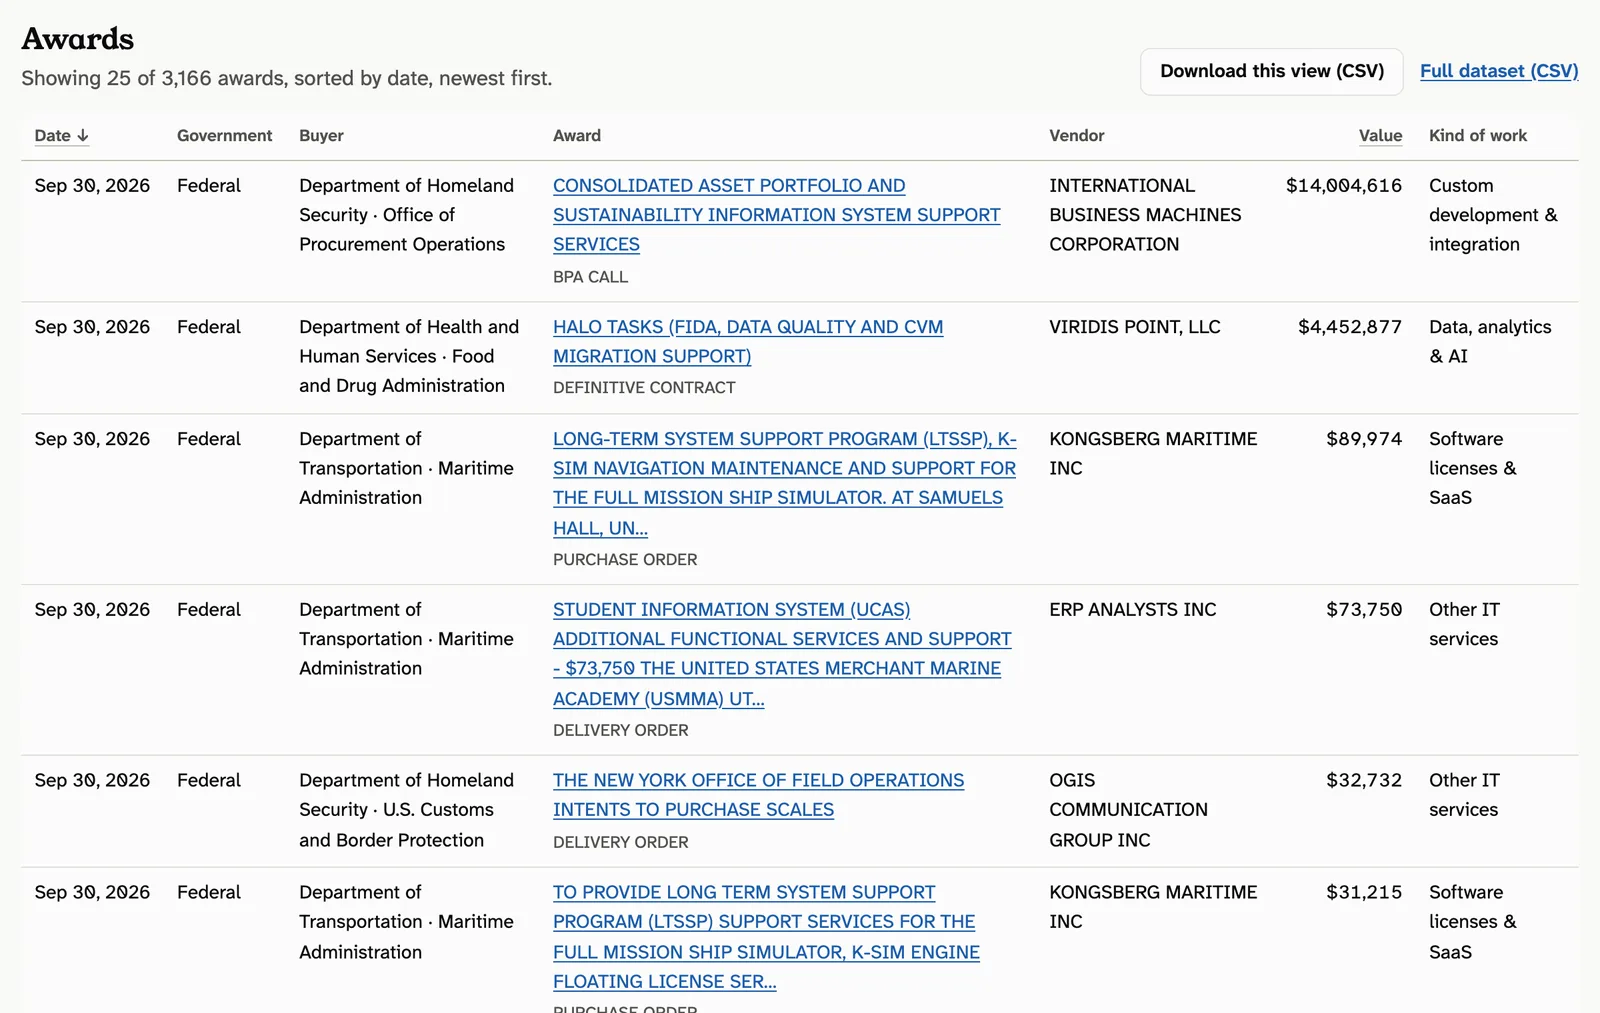
Every award links to its City Record notice, PARIS dataset, or USAspending record. The current view downloads as CSV.
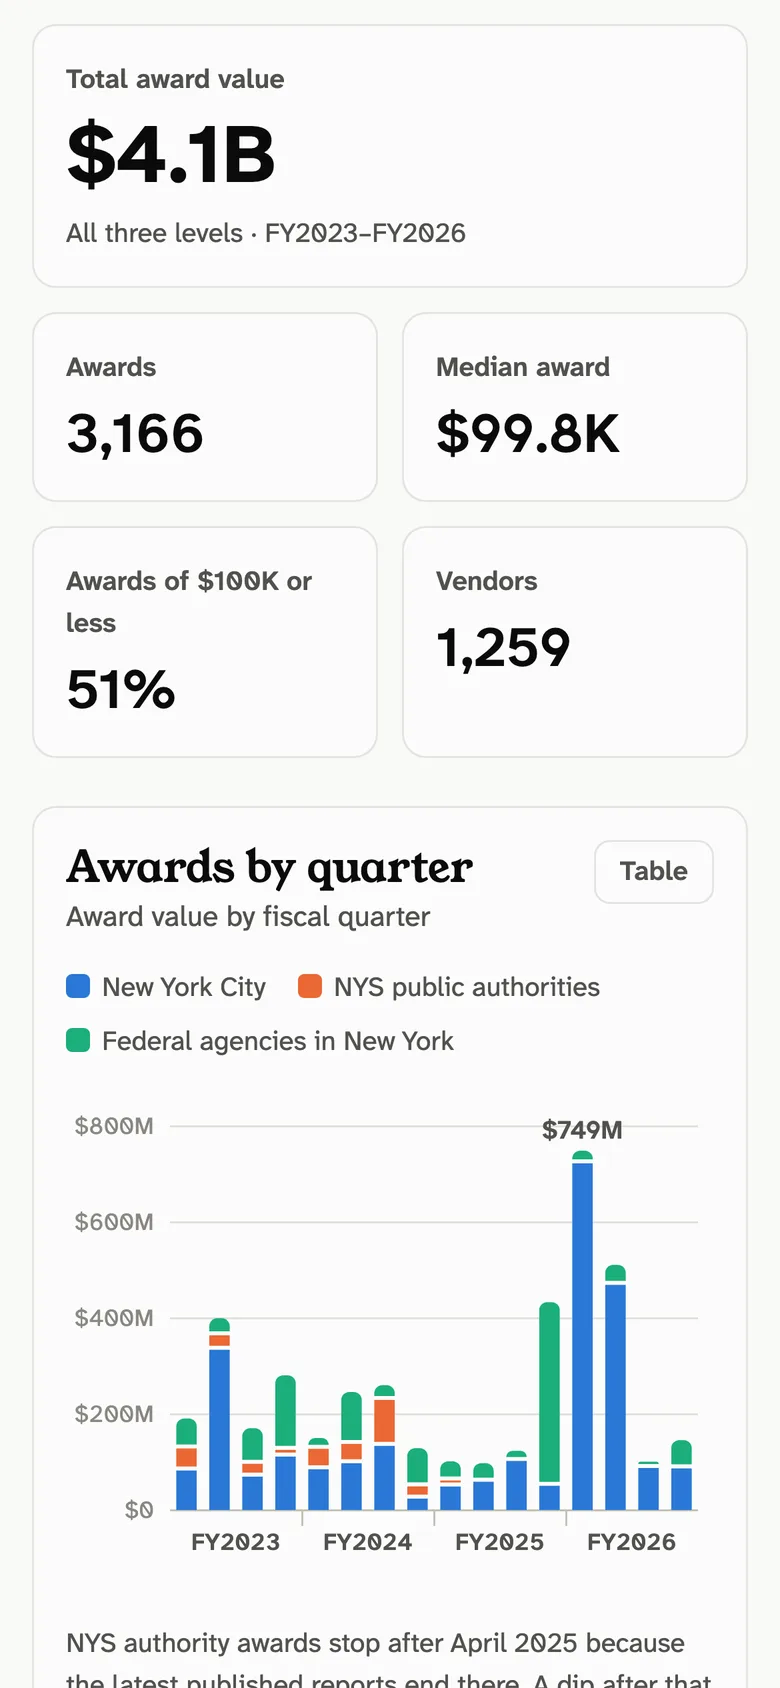
At phone width the charts redraw to fit and the award table becomes stacked rows, with no sideways scrolling.
What it answers
Which New York agencies buy software, data, and IT services, how large those awards are, who wins them, and how often small-business, SDVOSB, and M/WBE programs are used. It covers federal fiscal years 2023 to 2026 and every chart has a table view.
Three sources, one schema
NYC City Record award notices, the Procurement Report for State Authorities, and USAspending prime contract awards are fetched without accounts or keys, put on one schema, de-duplicated, and linked back to their source records. Some notices include a buyer's name, phone, and email; the pipeline strips them, and a test fails the build if one gets through.
Classification you can read
City Record notices cover everything the city buys, so a short set of keyword rules decides what counts as technology work and what kind it is. The rules live in one file, and the test suite pins real notice titles to their expected result, including ones the rules once got wrong.
Clear about its limits
Values are award amounts, not payments, and umbrella contracts report their ceilings. State authority reports lag about a year, and state agencies are not included yet. The dashboard's methodology section explains each of these next to the charts.
Built without a chart library
The charts are hand-built SVG. Colors come from a palette checked for color-vision deficiency in light and dark mode, tooltips work from the keyboard, and the page has no build step: plain HTML, CSS, and JavaScript modules deployed by GitHub Actions.